初学者 Linux strace 命令教程(8 个示例)
在此页
- Q1。如何使用 strace 命令?
- Q2。如何理解strace输出?
- Q3。如何使strace打印指令指针?
- Q4。如何为每个系统调用制作 strace 打印时间戳?
- Q5。如何为每条输出线添加时钟时间前缀?
- Q6。如何让strace显示系统调用所花费的时间?
- Q7。如何使 strace 打印摘要而不是通常的输出?
- 结论
Linux 命令行提供了许多对软件开发人员有帮助的工具。其中之一是 strace,一个跟踪 Linux 系统调用和信号的命令。本教程将使用一些易于理解的示例来讨论 strace 的基础知识。
但在此之前,值得一提的是,本文中的所有示例都已在 Ubuntu 22.04 LTS 和 Debian 11 机器上进行了测试。
Linux 中的 strace 命令可让您跟踪系统调用和信号。以下是它的语法:
strace [OPTIONS] command以下是工具手册页对其的解释:
       In  the simplest case strace runs the specified command until it exits.
       It intercepts and records the  system  calls  which  are  called  by  a
       process  and  the signals which are received by a process.  The name of
       each system call, its arguments and its return  value  are  printed  on
       standard error or to the file specified with the -o option.

       strace is a useful diagnostic, instructional, and debugging tool.  Sys?
       tem administrators, diagnosticians and trouble-shooters  will  find  it
       invaluable  for  solving problems with programs for which the source is
       not readily available since they do not need to be recompiled in  order
       to trace them.  Students, hackers and the overly-curious will find that
       a great deal can be learned about a system  and  its  system  calls  by
       tracing  even  ordinary programs.  And programmers will find that since
       system calls and signals are events  that  happen  at  the  user/kernel
       interface,  a close examination of this boundary is very useful for bug
       isolation, sanity checking and attempting to capture race conditions.
以下是一些 Q&A 风格的示例,可以让您更好地了解 strace 命令的工作原理。
安装 strace 命令
strace 命令在大多数系统上未默认安装,要在 Debian 和 Ubuntu 上安装它,请运行此命令:
sudo apt-get install straceQ1。如何使用 strace 命令?
基本用法很简单,只需将命令作为输入执行 strace 即可。例如,我将它与 ls 命令一起使用:
strace ls这是我系统上产生的输出:
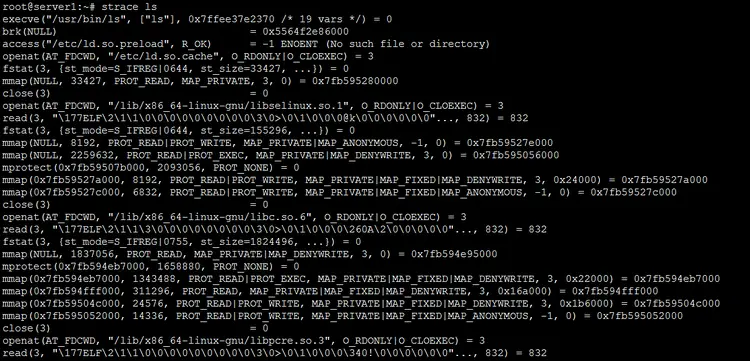
Q2。如何理解strace输出?
正如您在上一节的屏幕截图中所见,strace 命令会产生大量输出。所以你需要知道如何理解它。
手册页的以下摘录提供了切中要点的解释:
       Each line in the trace contains the system call name, followed  by  its
       arguments  in parentheses and its return value.  An example from strac?
       ing the command "cat /dev/null" is:

           open("/dev/null", O_RDONLY) = 3

       Errors (typically a return value of -1) have the errno symbol and error
       string appended.

           open("/foo/bar", O_RDONLY) = -1 ENOENT (No such file or directory)

       Signals are printed as signal symbol and decoded siginfo structure.  An
       excerpt from stracing and interrupting the command "sleep 666" is:

           sigsuspend([] <unfinished ...>
           --- SIGINT {si_signo=SIGINT, si_code=SI_USER, si_pid=...} ---
           +++ killed by SIGINT +++
Q3.如何使strace打印指令指针?
有一个选项 -i 告诉 strace 在系统调用时打印指令指针。
例如:
strace -i ls继承人的输出:
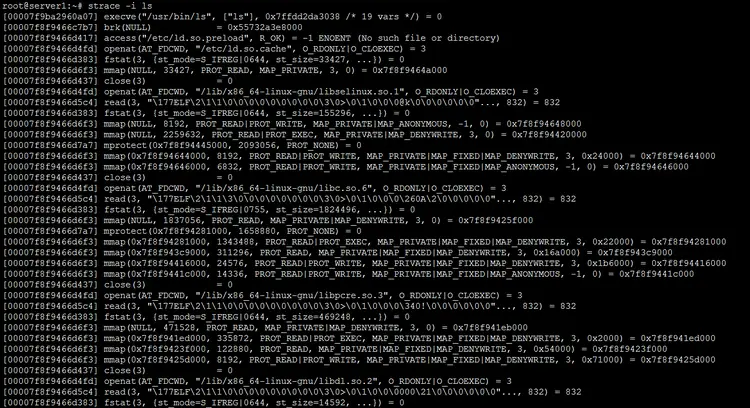
所以你可以看到指令指针打印在输出的每一行中。
Q4.如何为每个系统调用制作 strace 打印时间戳?
存在一个 -r 命令行选项,它告诉 strace 在进入每个系统调用时显示相对时间戳。工具手册页说这记录了连续系统调用开始之间的时间差。
例如:
strace -r ls以下是此命令产生的输出:
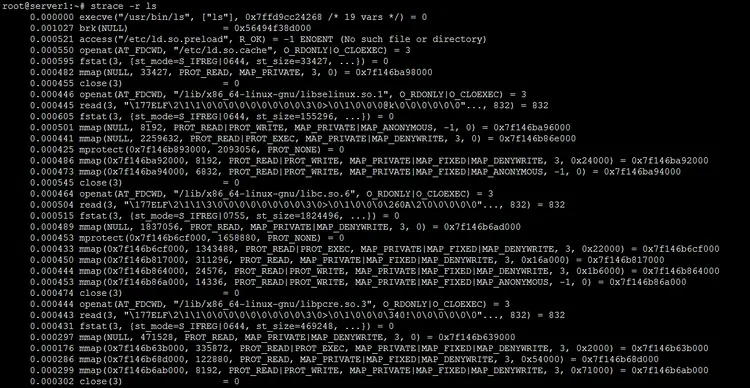
所以你可以看到在每一行的开头都产生了一个相对时间戳。
Q5.如何为每条输出线添加时钟时间前缀?
如果您希望 strace 输出中的每一行都以时钟时间开始,那么可以使用 -t 命令行选项来完成。
例如:
strace -t ls这是我系统上此命令的输出:
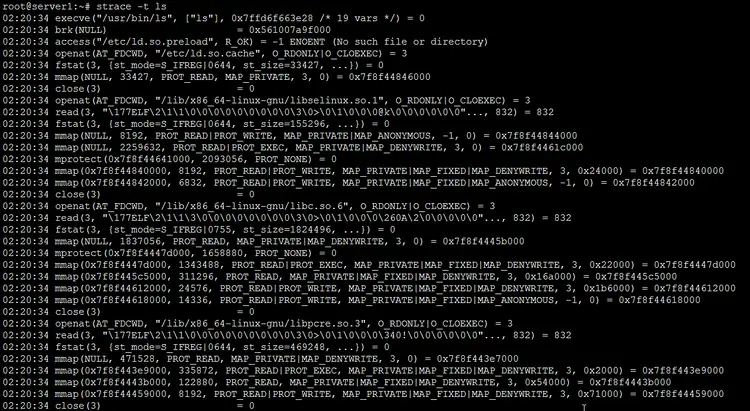
所以你可以看到系统时间打印在每一行的开头。
请注意,strace 提供了另外两个相关选项:
-tt
If given twice, the time printed will include the microseconds.

-ttt
If given thrice, the  time  printed  will  include  the microseconds and the leading portion will
be printed as the number of seconds since the epoch.
Q6.如何让strace显示系统调用所花费的时间?
这可以使用 -T 命令行选项来实现。
例如:
strace -T ls以下是输出:
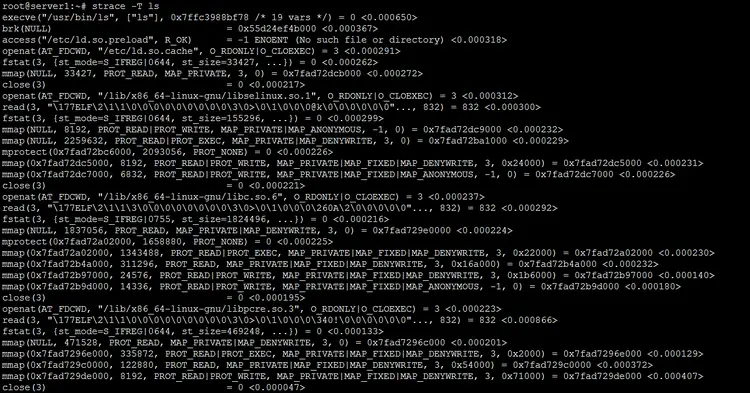
所以你可以看到在系统调用中花费的时间打印在每一行的末尾。
Q7.如何使 strace 打印摘要而不是通常的输出?
如果您希望该工具生成摘要,则可以使用 -c 命令行输出。
例如,以下命令:
strace -c ls在我的系统上产生了这个输出:
% time     seconds  usecs/call     calls    errors syscall
------ ----------- ----------- --------- --------- ----------------
 93.66    0.000133           5        28           write
  6.34    0.000009           1        11           close
  0.00    0.000000           0         7           read
  0.00    0.000000           0        10           fstat
  0.00    0.000000           0        17           mmap
  0.00    0.000000           0        12           mprotect
  0.00    0.000000           0         1           munmap
  0.00    0.000000           0         3           brk
  0.00    0.000000           0         2           rt_sigaction
  0.00    0.000000           0         1           rt_sigprocmask
  0.00    0.000000           0         2           ioctl
  0.00    0.000000           0         8         8 access
  0.00    0.000000           0         1           execve
  0.00    0.000000           0         2           getdents
  0.00    0.000000           0         2         2 statfs
  0.00    0.000000           0         1           arch_prctl
  0.00    0.000000           0         1           set_tid_address
  0.00    0.000000           0         9           openat
  0.00    0.000000           0         1           set_robust_list
  0.00    0.000000           0         1           prlimit64
------ ----------- ----------- --------- --------- ----------------
100.00    0.000142                   120        10 total
因此,您可以看到摘要让您了解每个系统调用进行了多少次调用,以及每个系统调用的时间相关信息。
结论
由于 strace 命令还提供了许多其他功能,我们在这里只是触及了皮毛。练习完我们在这里讨论的内容后,请前往 strace 手册页以了解有关该工具的更多信息。