Smem - 报告 Linux 中每个进程和每个用户的内存消耗
监控内存使用情况方面的内存管理是在 Linux 系统上要做的一件重要事情,您可以在不同的 Linux 发行版上找到许多可用于监控内存使用情况的工具。但它们的工作方式不同,在本指南中,我们将了解如何安装和使用名为 smem 的此类工具。
不要错过: 20 个监控 Linux 性能的命令行工具
Smem 是一个命令行内存报告工具,它为用户提供有关 Linux 系统上内存使用情况的各种报告。 smem 有一个独特之处,与其他传统内存报告工具不同,它报告 PSS(比例集大小),这是应用程序和库的内存使用情况的更有意义的表示。虚拟内存设置。

现有的传统工具主要侧重于读取RSS(Resident Set Size),这是监视物理内存方案中内存使用情况的标准措施,但往往会高估应用程序的内存使用情况。
另一方面,PSS 通过确定虚拟内存方案中应用程序和库使用的内存的“公平共享”来提供合理的衡量标准。
您可以阅读本指南(关于内存 RSS 和 PSS)来了解 Linux 系统中的内存消耗,但让我们继续了解 smem 的一些功能。
Smem工具的特点
- 系统概览列表
- 列表以及按进程、映射或用户进行过滤
- 使用 /proc 文件系统中的数据
- 来自多个数据源的可配置列表列
- 可配置的输出单位和百分比
- 轻松配置列表中的标题和总计
- 使用目录镜像或压缩 tar 文件中的数据快照
- 内置图表生成机制
- 嵌入式系统中使用的轻量级捕获工具
如何在 Linux 中安装 Smem – 内存报告工具
在继续安装 smem 之前,您的系统必须满足以下要求:
- 现代内核(> 2.6.27 左右)
- 最新版本的 Python(2.4 左右)
- 用于生成图表的可选 matplotlib 库
当今的大多数 Linux 发行版都附带最新的内核版本,支持 Python 2 或 3,因此唯一的要求是安装 matplotlib 库,该库是用于生成漂亮的图表。
在 RHEL、CentOS 和 Fedora 上
首先启用 EPEL(Extra Packages for Enterprise Linux)存储库,然后按如下方式安装:
yum install smem python-matplotlib python-tk
在 Debian 和 Ubuntu 上
sudo apt-get install smem
在 Linux Mint 上
sudo apt-get install smem python-matplotlib python-tk
在 Arch Linux 上
使用此 AUR 存储库。
如何在 Linux 中使用 Smem – 内存报告工具
要查看所有系统用户整个系统的内存使用情况报告,请运行以下命令:
$ sudo smem
 PID User     Command                         Swap      USS      PSS      RSS
 6367 tecmint  cat                                0      100      145     1784
 6368 tecmint  cat                                0      100      147     1676
 2864 tecmint  /usr/bin/ck-launch-session         0      144      165     1780
 7656 tecmint  gnome-pty-helper                   0      156      178     1832
 5758 tecmint  gnome-pty-helper                   0      156      179     1916
 1441 root     /sbin/getty -8 38400 tty2          0      152      184     2052
 1434 root     /sbin/getty -8 38400 tty5          0      156      187     2060
 1444 root     /sbin/getty -8 38400 tty3          0      156      187     2060
 1432 root     /sbin/getty -8 38400 tty4          0      156      188     2124
 1452 root     /sbin/getty -8 38400 tty6          0      164      196     2064
 2619 root     /sbin/getty -8 38400 tty1          0      164      196     2136
 3544 tecmint  sh -c /usr/lib/linuxmint/mi        0      212      224     1540
 1504 root     acpid -c /etc/acpi/events -        0      220      236     1604
 3311 tecmint  syndaemon -i 0.5 -K -R             0      252      292     2556
 3143 rtkit    /usr/lib/rtkit/rtkit-daemon        0      300      326     2548
 1588 root     cron                               0      292      333     2344
 1589 avahi    avahi-daemon: chroot helpe         0      124      334     1632
 1523 root     /usr/sbin/irqbalance               0      316      343     2096
  585 root     upstart-socket-bridge --dae        0      328      351     1820
 3033 tecmint  /usr/bin/dbus-launch --exit        0      328      360     2160
 1346 root     upstart-file-bridge --daemo        0      348      371     1776
 2607 root     /usr/bin/xdm                       0      188      378     2368
 1635 kernoops /usr/sbin/kerneloops               0      352      386     2684
  344 root     upstart-udev-bridge --daemo        0      400      427     2132
 2960 tecmint  /usr/bin/ssh-agent /usr/bin        0      480      485      992
 3468 tecmint  /bin/dbus-daemon --config-f        0      344      515     3284
 1559 avahi    avahi-daemon: running [tecm        0      284      517     3108
 7289 postfix  pickup -l -t unix -u -c            0      288      534     2808
 2135 root     /usr/lib/postfix/master            0      352      576     2872
 2436 postfix  qmgr -l -t unix -u                 0      360      606     2884
 1521 root     /lib/systemd/systemd-logind        0      600      650     3276
 2222 nobody   /usr/sbin/dnsmasq --no-reso        0      604      669     3288
....
当普通用户运行smem时,它会按用户启动的进程显示内存使用情况,进程按PSS递增的顺序排列。
查看我的系统上的以下输出,了解用户 aaronkilik 启动的进程的内存使用情况:
$ smem
 PID User     Command                         Swap      USS      PSS      RSS
 6367 tecmint  cat                                0      100      145     1784
 6368 tecmint  cat                                0      100      147     1676
 2864 tecmint  /usr/bin/ck-launch-session         0      144      166     1780
 3544 tecmint  sh -c /usr/lib/linuxmint/mi        0      212      224     1540
 3311 tecmint  syndaemon -i 0.5 -K -R             0      252      292     2556
 3033 tecmint  /usr/bin/dbus-launch --exit        0      328      360     2160
 3468 tecmint  /bin/dbus-daemon --config-f        0      344      515     3284
 3122 tecmint  /usr/lib/gvfs/gvfsd                0      656      801     5552
 3471 tecmint  /usr/lib/at-spi2-core/at-sp        0      708      864     5992
 3396 tecmint  /usr/lib/gvfs/gvfs-mtp-volu        0      804      914     6204
 3208 tecmint  /usr/lib/x86_64-linux-gnu/i        0      892     1012     6188
 3380 tecmint  /usr/lib/gvfs/gvfs-afc-volu        0      820     1024     6396
 3034 tecmint  //bin/dbus-daemon --fork --        0      920     1081     3040
 3365 tecmint  /usr/lib/gvfs/gvfs-gphoto2-        0      972     1099     6052
 3228 tecmint  /usr/lib/gvfs/gvfsd-trash -        0      980     1153     6648
 3107 tecmint  /usr/lib/dconf/dconf-servic        0     1212     1283     5376
 6399 tecmint  /opt/google/chrome/chrome -        0      144     1409    10732
 3478 tecmint  /usr/lib/x86_64-linux-gnu/g        0     1724     1820     6320
 7365 tecmint  /usr/lib/gvfs/gvfsd-http --        0     1352     1884     8704
 6937 tecmint  /opt/libreoffice5.0/program        0     1140     2328     5040
 3194 tecmint  /usr/lib/x86_64-linux-gnu/p        0     1956     2405    14228
 6373 tecmint  /opt/google/chrome/nacl_hel        0     2324     2541     8908
 3313 tecmint  /usr/lib/gvfs/gvfs-udisks2-        0     2460     2754     8736
 3464 tecmint  /usr/lib/at-spi2-core/at-sp        0     2684     2823     7920
 5771 tecmint  ssh -p 4521 [email         0     2544     2864     6540
 5759 tecmint  /bin/bash                          0     2416     2923     5640
 3541 tecmint  /usr/bin/python /usr/bin/mi        0     2584     3008     7248
 7657 tecmint  bash                               0     2516     3055     6028
 3127 tecmint  /usr/lib/gvfs/gvfsd-fuse /r        0     3024     3126     8032
 3205 tecmint  mate-screensaver                   0     2520     3331    18072
 3171 tecmint  /usr/lib/mate-panel/notific        0     2860     3495    17140
 3030 tecmint  x-session-manager                  0     4400     4879    17500
 3197 tecmint  mate-volume-control-applet         0     3860     5226    23736
...
使用 smem 时可以调用许多选项,例如,要查看系统范围的内存消耗,请运行以下命令:
$ sudo smem -w
Area                           Used      Cache   Noncache
firmware/hardware                 0          0          0
kernel image                      0          0          0
kernel dynamic memory       1425320    1291412     133908
userspace memory            2215368     451608    1763760
free memory                 4424936    4424936          0
要查看每个用户的内存使用情况,请运行以下命令:
$ sudo smem -u
User     Count     Swap      USS      PSS      RSS
rtkit        1        0      300      326     2548
kernoops     1        0      352      385     2684
avahi        2        0      408      851     4740
postfix      2        0      648     1140     5692
messagebus     1        0     1012     1173     3320
syslog       1        0     1396     1419     3232
www-data     2        0     5100     6572    13580
mpd          1        0     7416     8302    12896
nobody       2        0     4024    11305    24728
root        39        0   323876   353418   496520
tecmint     64        0  1652888  1815699  2763112
您还可以通过映射来报告内存使用情况,如下所示:
$ sudo smem -m
Map                                       PIDs   AVGPSS      PSS
/dev/fb0                                     1        0        0
/home/tecmint/.cache/fontconfig/7ef2298f    18        0        0
/home/tecmint/.cache/fontconfig/c57959a1    18        0        0
/home/tecmint/.local/share/mime/mime.cac    15        0        0
/opt/google/chrome/chrome_material_100_p     9        0        0
/opt/google/chrome/chrome_material_200_p     9        0        0
/usr/lib/x86_64-linux-gnu/gconv/gconv-mo    41        0        0
/usr/share/icons/Mint-X-Teal/icon-theme.    15        0        0
/var/cache/fontconfig/0c9eb80ebd1c36541e    20        0        0
/var/cache/fontconfig/0d8c3b2ac0904cb8a5    20        0        0
/var/cache/fontconfig/1ac9eb803944fde146    20        0        0
/var/cache/fontconfig/3830d5c3ddfd5cd38a    20        0        0
/var/cache/fontconfig/385c0604a188198f04    20        0        0
/var/cache/fontconfig/4794a0821666d79190    20        0        0
/var/cache/fontconfig/56cf4f4769d0f4abc8    20        0        0
/var/cache/fontconfig/767a8244fc0220cfb5    20        0        0
/var/cache/fontconfig/8801497958630a81b7    20        0        0
/var/cache/fontconfig/99e8ed0e538f840c56    20        0        0
/var/cache/fontconfig/b9d506c9ac06c20b43    20        0        0
/var/cache/fontconfig/c05880de57d1f5e948    20        0        0
/var/cache/fontconfig/dc05db6664285cc2f1    20        0        0
/var/cache/fontconfig/e13b20fdb08344e0e6    20        0        0
/var/cache/fontconfig/e7071f4a29fa870f43    20        0        0
....
还有用于过滤 smem 输出的选项,我们将在此处查看两个示例。
要按用户名过滤输出,请调用-u或--userfilter="regex"选项,如下所示:
$ sudo smem -u
User     Count     Swap      USS      PSS      RSS
rtkit        1        0      300      326     2548
kernoops     1        0      352      385     2684
avahi        2        0      408      851     4740
postfix      2        0      648     1140     5692
messagebus     1        0     1012     1173     3320
syslog       1        0     1400     1423     3236
www-data     2        0     5100     6572    13580
mpd          1        0     7416     8302    12896
nobody       2        0     4024    11305    24728
root        39        0   323804   353374   496552
tecmint     64        0  1708900  1871766  2819212
要按进程名称过滤输出,请调用 -P 或 --processfilter="regex" 选项,如下所示:
$ sudo smem --processfilter="firefox"
PID User     Command                         Swap      USS      PSS      RSS
 9212 root     sudo smem --processfilter=f        0     1172     1434     4856
 9213 root     /usr/bin/python /usr/bin/sm        0     7368     7793    11984
 4424 tecmint  /usr/lib/firefox/firefox           0   931732   937590   961504
输出格式非常重要,有一些选项可以帮助您格式化内存报告,我们将看一下下面的几个示例。
要在报告中显示所需的列,请使用 -c 或 --columns 选项,如下所示:
$ sudo smem -c "name user pss rss"
Name                     User          PSS      RSS
cat                      tecmint       145     1784
cat                      tecmint       147     1676
ck-launch-sessi          tecmint       165     1780
gnome-pty-helpe          tecmint       178     1832
gnome-pty-helpe          tecmint       179     1916
getty                    root          184     2052
getty                    root          187     2060
getty                    root          187     2060
getty                    root          188     2124
getty                    root          196     2064
getty                    root          196     2136
sh                       tecmint       224     1540
acpid                    root          236     1604
syndaemon                tecmint       296     2560
rtkit-daemon             rtkit         326     2548
cron                     root          333     2344
avahi-daemon             avahi         334     1632
irqbalance               root          343     2096
upstart-socket-          root          351     1820
dbus-launch              tecmint       360     2160
upstart-file-br          root          371     1776
xdm                      root          378     2368
kerneloops               kernoops      386     2684
upstart-udev-br          root          427     2132
ssh-agent                tecmint       485      992
...
您可以调用 -p 选项以百分比报告内存使用情况,如以下命令所示:
$ sudo smem -p
 PID User     Command                         Swap      USS      PSS      RSS
 6367 tecmint  cat                            0.00%    0.00%    0.00%    0.02%
 6368 tecmint  cat                            0.00%    0.00%    0.00%    0.02%
 9307 tecmint  sh -c { sudo /usr/lib/linux    0.00%    0.00%    0.00%    0.02%
 2864 tecmint  /usr/bin/ck-launch-session     0.00%    0.00%    0.00%    0.02%
 3544 tecmint  sh -c /usr/lib/linuxmint/mi    0.00%    0.00%    0.00%    0.02%
 5758 tecmint  gnome-pty-helper               0.00%    0.00%    0.00%    0.02%
 7656 tecmint  gnome-pty-helper               0.00%    0.00%    0.00%    0.02%
 1441 root     /sbin/getty -8 38400 tty2      0.00%    0.00%    0.00%    0.03%
 1434 root     /sbin/getty -8 38400 tty5      0.00%    0.00%    0.00%    0.03%
 1444 root     /sbin/getty -8 38400 tty3      0.00%    0.00%    0.00%    0.03%
 1432 root     /sbin/getty -8 38400 tty4      0.00%    0.00%    0.00%    0.03%
 1452 root     /sbin/getty -8 38400 tty6      0.00%    0.00%    0.00%    0.03%
 2619 root     /sbin/getty -8 38400 tty1      0.00%    0.00%    0.00%    0.03%
 1504 root     acpid -c /etc/acpi/events -    0.00%    0.00%    0.00%    0.02%
 3311 tecmint  syndaemon -i 0.5 -K -R         0.00%    0.00%    0.00%    0.03%
 3143 rtkit    /usr/lib/rtkit/rtkit-daemon    0.00%    0.00%    0.00%    0.03%
 1588 root     cron                           0.00%    0.00%    0.00%    0.03%
 1589 avahi    avahi-daemon: chroot helpe     0.00%    0.00%    0.00%    0.02%
 1523 root     /usr/sbin/irqbalance           0.00%    0.00%    0.00%    0.03%
  585 root     upstart-socket-bridge --dae    0.00%    0.00%    0.00%    0.02%
 3033 tecmint  /usr/bin/dbus-launch --exit    0.00%    0.00%    0.00%    0.03%
....
下面的命令将在输出的每列末尾显示总计:
$ sudo smem -t
PID User     Command                         Swap      USS      PSS      RSS
 6367 tecmint  cat                                0      100      139     1784
 6368 tecmint  cat                                0      100      141     1676
 9307 tecmint  sh -c { sudo /usr/lib/linux        0       96      158     1508
 2864 tecmint  /usr/bin/ck-launch-session         0      144      163     1780
 3544 tecmint  sh -c /usr/lib/linuxmint/mi        0      108      170     1540
 5758 tecmint  gnome-pty-helper                   0      156      176     1916
 7656 tecmint  gnome-pty-helper                   0      156      176     1832
 1441 root     /sbin/getty -8 38400 tty2          0      152      181     2052
 1434 root     /sbin/getty -8 38400 tty5          0      156      184     2060
 1444 root     /sbin/getty -8 38400 tty3          0      156      184     2060
 1432 root     /sbin/getty -8 38400 tty4          0      156      185     2124
 1452 root     /sbin/getty -8 38400 tty6          0      164      193     2064
 2619 root     /sbin/getty -8 38400 tty1          0      164      193     2136
 1504 root     acpid -c /etc/acpi/events -        0      220      232     1604
 3311 tecmint  syndaemon -i 0.5 -K -R             0      260      298     2564
 3143 rtkit    /usr/lib/rtkit/rtkit-daemon        0      300      324     2548
 1588 root     cron                               0      292      326     2344
 1589 avahi    avahi-daemon: chroot helpe         0      124      332     1632
 1523 root     /usr/sbin/irqbalance               0      316      340     2096
  585 root     upstart-socket-bridge --dae        0      328      349     1820
 3033 tecmint  /usr/bin/dbus-launch --exit        0      328      359     2160
 1346 root     upstart-file-bridge --daemo        0      348      370     1776
 2607 root     /usr/bin/xdm                       0      188      375     2368
 1635 kernoops /usr/sbin/kerneloops               0      352      384     2684
  344 root     upstart-udev-bridge --daemo        0      400      426     2132
.....
-------------------------------------------------------------------------------
  134 11                                          0  2171428  2376266  3587972
此外,您还可以使用图形报告的选项,我们将在本小节中深入探讨它们。
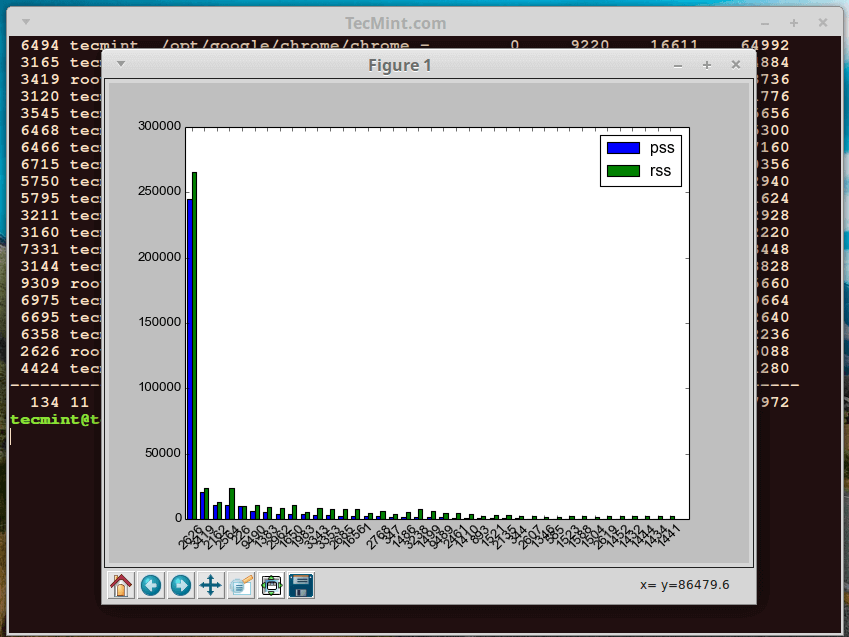
您可以生成进程及其 PSS 和 RSS 值的条形图,在下面的示例中,我们生成 root 用户拥有的进程的条形图。
垂直面显示进程的 PSS 和 RSS 度量,水平面表示每个根用户进程:
$ sudo smem --userfilter="root" --bar pid -c"pss rss"
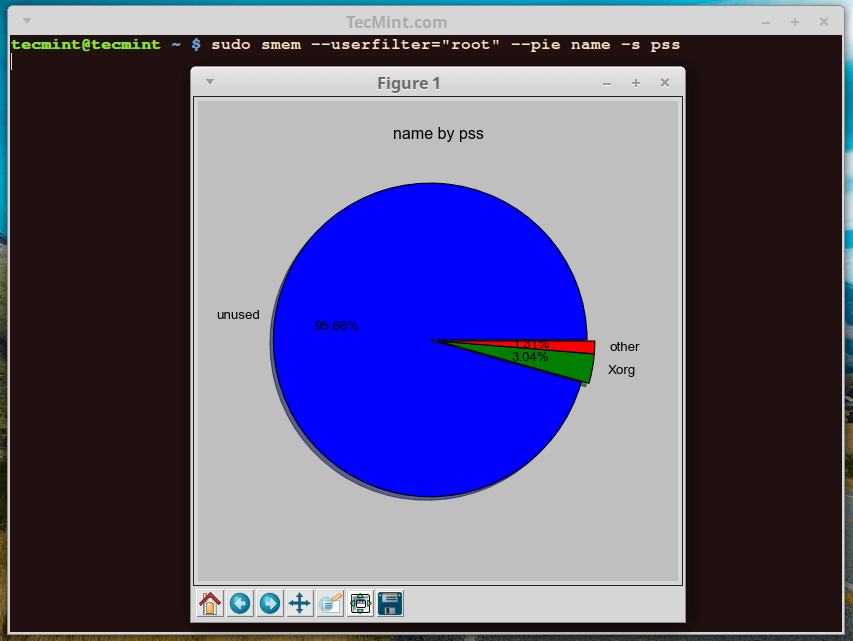
您还可以根据 PSS 或 RSS 值生成显示进程及其内存消耗的饼图。下面的命令输出 root 用户拥有的进程测量值的饼图。
--pie 名称表示按名称进行标签,-s 选项有助于按 PSS 值排序。
$ sudo smem --userfilter="root" --pie name -s pss
除了用于标记图表的 PSS 和 RSS 之外,还有许多其他已知字段:
要获得帮助,只需键入 smem -h 或访问手动输入页面。
我们将在这里停止 smem,但为了更好地理解它,请将它与您可以在手册页中找到的许多其他选项一起使用。像往常一样,您可以使用下面的评论部分来表达任何想法或疑虑。
参考链接:https://www.selenic.com/smem/