初学者 Linux tload 命令教程(附示例)
在此页
- Linux tload 命令
- Q1。如何使用加载?
- Q2。 tload 是否提供任何缩放选项?
- Q3。如何设置图形更新延迟?
- 结论
虽然 Linux 中有许多基于 UI 的工具可用于查看系统负载的图形表示,但执行相同工作的命令行工具的数量却很少。一个这样的实用程序是 tload,它将在本教程中讨论。
但在此之前,值得一提的是,本文中的所有示例都已在 Ubuntu 18.04 LTS 机器上进行了测试。
Linux tload 命令
Linux 中的 tload 命令为您提供了系统平均负载的图形表示。以下是它的语法:
tload [options] [tty]以下是工具手册页对其的解释:
tload  prints  a  graph  of the current system load average to the specified tty (or the tty of
the tload process if none is specified).
以下是一些 Q&A 风格的示例,它们可以让您更好地了解 tload 命令的工作原理。
Q1。如何使用加载?
基本用法非常简单 - 只需执行 tload sans 任何选项。输出中生成的图表可能需要一些时间来构建,但一段时间后,您会看到如下内容:
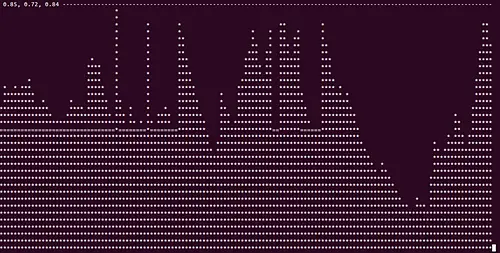
如您所见,该图由 *、= 和 - 等符号组成。虽然工具手册页没有说明这些符号,但在 serverfault 线程上对此有一些有用的解释。
It's just the graphical (weird) representation of the last minute load average of the system over
the time.

The "*"s are just the representation of the level of load average. Understand it as a clasical
"area graph". The "-" sings just define the unities of load, and the "=" substitute the "-" when
the bar passes the line that marks the unit of the graph.
Q2。 tload 是否提供任何缩放选项?
是的,它确实。选项是 -s。以下是工具手册页对其的解释:
The scale option allows a vertical scale to be specified for the display  (in  characters
between  graph  ticks);  thus, a smaller value represents a larger scale, and vice versa.
例如:
tload -s 20Q3.如何设置图形更新延迟?
当您运行 tload 命令时,您会注意到它生成的图表不断更新。但是,如果需要,您可以设置图形更新之间的延迟。
这可以使用 -d 命令行选项来完成。例如:
tload -d 5此命令将确保图形在 5 秒后更新。
结论
同意,此命令主要供系统管理员使用。它提供的选项数量也有限。我们已经讨论了该实用程序提供的主要选项。要了解更多信息,请前往 tload 手册页。